Improved Aho-Corasick in Haskell

I was disappointed at the poor performance of my last attempt at string matching in Haskell, so I decided to rewrite it using the high-performance Data.Map and Data.Array data structures. This makes the semantics a lot closer to an imperative C implementation. The result isn’t so elegant, but it is predictable due to guarantees on the asymptotic performance of the array and map functions. It’s also fast.

This highlights one of the big problems in writing fast Haskell: the elegant, recursive, list-based style you learnt is unpredictable in terms of time complexity. You know not to use ++ where cons would do, and more generally aim for tail recursion; but when you need to decide what should be boxed/unboxed/strict/lazy it’s very frustrating. Without being very familiar with what reduction strategy the compiler used, it was unclear what was actually going on with my previous code until I pulled out the profiler.
Continue reading “Improved Aho-Corasick in Haskell”

XHTML fixes for the WordPress reCAPTCHA plugin

The wp-recaptcha plugin for WordPress breaks when you’re serving pages as application/xhtml+xml. I inadvertently broke comments when I installed it (silly me for not testing!). I’ve written a patch that fixes it.

The default javascript API uses document.write, which isn’t a DOM method and hence is not a method of true XML documents. It’s not a new issue either, wp-recaptcha has had a history of breaking XHTML. The thing is, the WordPress plugin (which uses the PHP library by the recaptcha people) has an option to “Be XHTML 1.0 Strict compliant”; but this only fixes the use of iframes and noscript!

Updated: pushed fork to github
Continue reading “XHTML fixes for the WordPress reCAPTCHA plugin”

Duplicating ggplot axis labels

Update: the lemon package’s facet_rep_wrap gives the user control over repeated facet labels (thanks to Flore for pointing it out).

I’ve been trying for a while to find an elegant solution for duplicating axis ticks and labels in a ggplot chart. Hadley replied on the ggplot2 mailing list, but a working solution within ggplot2 seems a way off.

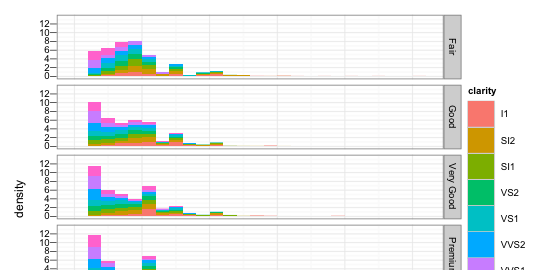
The situation is this: imagine you have a faceted plot that is tall enough that the x-axis ticks and labels become obscured (e.g. when using a clipped viewport such as a browser window). This is particularly destructive when you’re using an x-scale with manual breaks or a transformation.

library(ggplot2)
g <- ggplot(diamonds, aes(carat, ..density..)) + 
   geom_histogram(aes(fill = clarity), binwidth = 0.2) + 
   facet_grid(cut ~ .)
print(g)

Faceted Plot where the x-axis labels have been clipped out

There simply isn’t a way to repeat the x-axis labels in ggplot2 at the moment without discarding faceting and rendering each facet as a separate ggplot call. I’ve seen some examples of selective plotting used to good effect in combining multiple plots with common elements, but I can’t find anything applicable to keep consistent scales and binning without duplicating a lot of the (internal) facet and bin logic.

Continue reading “Duplicating ggplot axis labels”