Update: the lemon package’s facet_rep_wrap gives the user control over repeated facet labels (thanks to Flore for pointing it out).
I’ve been trying for a while to find an elegant solution for duplicating axis ticks and labels in a ggplot chart. Hadley replied on the ggplot2 mailing list, but a working solution within ggplot2 seems a way off.
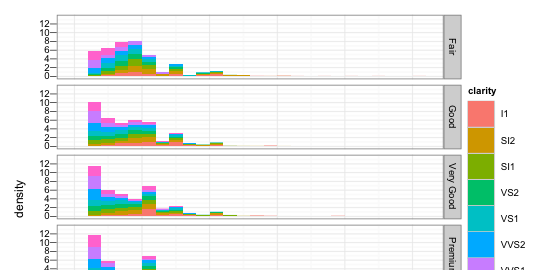
The situation is this: imagine you have a faceted plot that is tall enough that the x-axis ticks and labels become obscured (e.g. when using a clipped viewport such as a browser window). This is particularly destructive when you’re using an x-scale with manual breaks or a transformation.
library(ggplot2)
g <- ggplot(diamonds, aes(carat, ..density..)) +
   geom_histogram(aes(fill = clarity), binwidth = 0.2) +
   facet_grid(cut ~ .)
print(g)

There simply isn’t a way to repeat the x-axis labels in ggplot2 at the moment without discarding faceting and rendering each facet as a separate ggplot call. I’ve seen some examples of selective plotting used to good effect in combining multiple plots with common elements, but I can’t find anything applicable to keep consistent scales and binning without duplicating a lot of the (internal) facet and bin logic.
Instead my best shot was to clone some of the grob elements and redraw them at different locations:
grob <- ggplotGrob(g)
xtext <- getGrob(grob, "layout::axis_h::axis.text", grep = TRUE)
xtext <- editGrob(xtext, gp = gpar(fontsize = 8))
downViewport("background::panels::layout::axis_h-13-3") # ids from grid.ls()
pushViewport(viewport(y = unit(34, "npc"), name = "axis_h_rep-1"))
 grid.draw(xtext)
popViewport()
Unfortunately I couldn’t find a consistent way of querying the grid graphics internals for the measurements necessary to move the “mirrored” axis labels to the right place. The 34 there is a magic number I found with grid.locator() and trial-and-error; it changes depending on the graphics device. At one point I hoped I could clone the entire axis_h viewport, pry some vertical space from in between the facet panels, and paste the clones in between. Unfortunately grid layouts don’t seem to be very mutable once they’ve been created, and redrawing the text grob seemed like the best I could do to reuse the output.
While looking at the stackoverflow answer for the same problem, I came across Harlan’s assessment:
GGplot’s philosophy is about doing the right thing with a minimum of customization, which means, naturally, that you can’t customize things as much as other packages.
This is more significant when contrasted with the context of R itself; in R, the user retains full control. Coming up against ggplot’s choice of only exposing high-level primitives often leaves the user with the choice of:
- accepting The Way ggplot Does Things and not getting what they want
- waiting for Hadley to write a patch (next summer, if you’re lucky?)
- wading through ggplot internals so you can duplicate its functionality with
plyrandgridcalls - abandoning ggplot completely
You get what you pay for ;)
Sure (and I love your work!), but the ggplot2 internals are already written, it’s just a pity they’re not exposed and the plot objects are opaque.
That said, I did omit the option of “adding the functionality to ggplot2 internally and then submitting a patch to the list”, which I’m not afraid to do ;)
Use the scales=”free” option in your facet wrap. Should do the trick.
@robert: no, it won’t.
scales="free"does not keep consistent scales. I just want to repeat the labels, rather than allow the scales to change for each facet. Furthermore, in the given example,facet_grid(cut ~ ., scales = "free")won’t even print extra labels.Hey !! for the ones who are having the same problem, the function called “facet_rep_wrap” or “facet_rep_grid” on the “lemon” package allows to keep the same axes for every graph:
facet_rep_wrap(~ Data, repeat.tick.labels=TRUE)